Fund Type
Super Savings Fund which is an Equity Fund and Feeder Fund
Dividend Policy
Dividends shall be paid when the Fund has retained earnings and such dividend payment shall not result in the Fund incurring retained losses during the accounting period for which the dividends are paid out. In the event that the dividend payment is less than 0.25 baht per unit, the Fund reserves the right not to pay. For further detail pertaining to dividend payment, please study Fund Prospectus and Fund Project and Commitment.
Objective
To raise fund from general investors and to invest in unit trust of foreign mutual fund which focus investing in equity instruments of United State in accordance with the investment policy specified in the Fund Project.
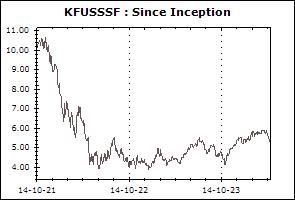
Inception Date
14 October 2021
Investment Policy
Minimum of 80% of NAV in average of fund accounting year is invested in the investment units of foreign fund titled GQG Partners US Equity Fund (the master fund) that seeks to invest at least 80% of its net assets in equity securities or equity-linked instruments, including common stock, preferred stock and options, of U.S. companies. The master fund also may invest in equity securities of non-U.S. companies in both developed and Emerging Markets. (Effective since 1 November 2024.)
Fund Manager
Jaturun Sornvai, Chusak Ouypornchaisakul
Asset Allocation
-
Return Chart
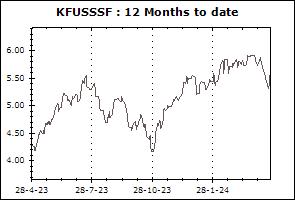
NAV Movement
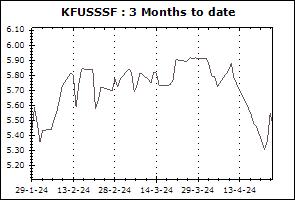
- 3 Months
- 12 Months
- Since inception
Transaction Details
Minimum Purchase Amount (Baht): 500
Minimum Redemption Amount (Unit): None
Transaction Period: Every dealing date of the fund by 15.30 hrs
Proceeds Payment Period: 4 working days after the execution day excluding relevant Master Fund’s holidays (T+4)
Fund Redemption Period: Every dealing date of the fund by 15.30 hrs
Transaction Channel: Krungsri Asset Management,Online Service,AGENT
Asset Allocation (30 Jun 2026)
| GQG Partners US Equity Fund Class I USD Accumulating | 101.01% |
| Other Assets | 1.31% |
| Other Liabilities | -2.32% |
Super Savings Fund (SSF)

| Fund | Historical Returns | Fund Size (mil) | |||||||
| % Cumulative Return | % Annualized Return | Since Inception | |||||||
| 3 Months | 6 Months | YTD | 1 Year | 3 Years | 5 Years | 10 Years | |||
| Krungsri Cash Management-SSF (KFCASHSSF) | +0.15% | +0.35% | +0.35% | +0.86% | +1.43% | +1.04% | N/A | +0.87% | 616 |
| Benchmark(4) | +0.19% | +0.40% | +0.40% | +0.93% | +1.34% | +1.03% | N/A | +0.91% | |
| Standard Deviation of Fund | +0.03% | +0.03% | +0.03% | +0.03% | +0.07% | +0.06% | N/A | +0.06% | |
| Standard Deviation of Benchmark | +0.03% | +0.03% | +0.03% | +0.02% | +0.02% | +0.02% | N/A | +0.02% | |
| Krungsri Active Fixed Income-SSF (KFAFIXSSF) | +1.01% | +0.01% | +0.01% | +0.68% | +2.76% | +1.95% | N/A | +1.93% | 1,055 |
| Benchmark(5) | +0.89% | +0.23% | +0.23% | +1.37% | +2.69% | +1.70% | N/A | +1.65% | |
| Standard Deviation of Fund | +1.28% | +1.53% | +1.53% | +1.27% | +0.89% | +0.89% | N/A | +0.90% | |
| Standard Deviation of Benchmark | +1.07% | +1.27% | +1.27% | +1.05% | +0.84% | +0.99% | N/A | +0.97% | |
| Krungsri Happy Life-SSF (KFHAPPYSSF) | +1.77% | +3.05% | +3.05% | +6.29% | +3.08% | +1.50% | N/A | +2.00% | 221 |
| Benchmark(6) | +2.78% | +6.46% | +6.46% | +10.89% | +2.92% | +1.87% | N/A | +2.94% | |
| Standard Deviation of Fund | +2.46% | +3.80% | +3.80% | +3.05% | +2.54% | +2.31% | N/A | +2.50% | |
| Standard Deviation of Benchmark | +2.50% | +3.41% | +3.41% | +2.99% | +2.54% | +2.29% | N/A | +2.47% | |
| Krungsri The One Mild SSF (KF1MILDSSF) | +4.07% | +2.76% | +2.76% | +6.23% | N/A | N/A | N/A | +3.67% | 15 |
| Benchmark(7) | +3.17% | +5.38% | +5.38% | +11.77% | N/A | N/A | N/A | +8.04% | |
| Standard Deviation of Fund | +6.15% | +5.83% | +5.83% | +4.45% | N/A | N/A | N/A | +4.00% | |
| Standard Deviation of Benchmark | +3.76% | +4.29% | +4.29% | +3.62% | N/A | N/A | N/A | +3.31% | |
| Krungsri The One Mean SSF (KF1MEANSSF) | +6.11% | +4.32% | +4.32% | +8.37% | N/A | N/A | N/A | +3.78% | 8 |
| Benchmark(8) | +5.55% | +9.35% | +9.35% | +19.20% | N/A | N/A | N/A | +11.01% | |
| Standard Deviation of Fund | +7.85% | +7.47% | +7.47% | +5.84% | N/A | N/A | N/A | +5.55% | |
| Standard Deviation of Benchmark | +6.36% | +7.09% | +7.09% | +5.99% | N/A | N/A | N/A | +5.68% | |
| Krungsri The One Max SSF (KF1MAXSSF) | +7.89% | +6.09% | +6.09% | +11.42% | N/A | N/A | N/A | +5.23% | 14 |
| Benchmark(9) | +8.75% | +13.19% | +13.19% | +27.76% | N/A | N/A | N/A | +16.21% | |
| Standard Deviation of Fund | +9.62% | +9.08% | +9.08% | +7.27% | N/A | N/A | N/A | +7.14% | |
| Standard Deviation of Benchmark | +9.98% | +10.59% | +10.59% | +8.98% | N/A | N/A | N/A | +8.78% | |
| Krungsri Enhanced SET50-SSF (KFENS50SSF) | +8.99% | +29.27% | +29.27% | +52.83% | +6.66% | +3.93% | N/A | +8.03% | 879 |
| SET50 TRI | +8.95% | +28.81% | +28.81% | +54.19% | +8.48% | +5.37% | N/A | +8.78% | |
| Standard Deviation of Fund | +12.71% | +19.34% | +19.34% | +17.72% | +16.43% | +14.77% | N/A | +16.58% | |
| Standard Deviation of Benchmark | +12.39% | +19.00% | +19.00% | +17.26% | +16.03% | +14.47% | N/A | +16.21% | |
| Krungsri Dividend Stock SSF (KFDIVSSF) | +10.31% | +23.73% | +23.73% | +39.64% | +2.06% | -0.58% | N/A | +0.74% | 644 |
| SET TRI | +11.47% | +30.31% | +30.31% | +52.90% | +6.07% | +3.65% | N/A | +7.07% | |
| Standard Deviation of Fund | +11.48% | +16.84% | +16.84% | +14.86% | +14.28% | +13.10% | N/A | +13.58% | |
| Standard Deviation of Benchmark | +15.23% | +20.38% | +20.38% | +17.84% | +15.48% | +13.93% | N/A | +14.54% | |
| Krungsri SET100-SSF (KFS100SSF) | +9.21% | +29.09% | +29.09% | +53.55% | +6.91% | +3.94% | N/A | +6.19% | 693 |
| SET100 TRI | +9.38% | +29.04% | +29.04% | +54.85% | +7.25% | +4.09% | N/A | +6.39% | |
| Standard Deviation of Fund | +12.44% | +19.25% | +19.25% | +17.50% | +16.07% | +14.43% | N/A | +15.16% | |
| Standard Deviation of Benchmark | +12.63% | +19.44% | +19.44% | +17.61% | +16.17% | +14.54% | N/A | +15.24% | |
| Tracking Difference (TD) | N/A | N/A | N/A | -1.30% | N/A | N/A | N/A | N/A | |
| Tracking Error (TE) | N/A | N/A | N/A | +0.57% | N/A | N/A | N/A | N/A | |
| Krungsri Global Core Allocation SSF (KFCORESSF) | +9.40% | +6.74% | +6.74% | +14.92% | N/A | N/A | N/A | +8.70% | 51 |
| Standard Deviation of Fund | +9.42% | +8.98% | +8.98% | +7.98% | N/A | N/A | N/A | +8.00% | |
| Krungsri Global Brands Equity Dividend SSF (KFGBRANSSF) | -0.37% | -14.30% | -14.30% | -20.38% | -4.35% | -3.18% | N/A | +1.33% | 1,592 |
| Benchmark(10) | +1.77% | -7.98% | -7.98% | -15.30% | -2.29% | +1.10% | N/A | +5.22% | |
| Standard Deviation of Fund | +14.41% | +14.41% | +14.41% | +11.79% | +11.79% | +14.52% | N/A | +14.45% | |
| Standard Deviation of Benchmark | +13.58% | +14.23% | +14.23% | +12.74% | +13.41% | +15.19% | N/A | +15.11% | |
| Krungsri China A Shares Equity SSF (KF-ACHINASSF) | +7.73% | +1.90% | +1.90% | +10.28% | +2.05% | -9.81% | N/A | -9.48% | 395 |
| Benchmark(10) | +9.90% | +9.30% | +9.30% | +17.23% | +3.75% | -6.05% | N/A | -4.80% | |
| Standard Deviation of Fund | +19.95% | +18.84% | +18.84% | +15.40% | +15.65% | +18.99% | N/A | +19.27% | |
| Standard Deviation of Benchmark | +18.83% | +19.57% | +19.57% | +16.28% | +17.20% | +19.72% | N/A | +20.02% | |
| Krungsri US Equity SSF (KFUSSSF) | -6.64% | +0.18% | +0.18% | -4.60% | +3.49% | N/A | N/A | -11.33% | 92 |
| Benchmark(10) | -4.66% | +8.13% | +8.13% | +2.14% | +6.01% | N/A | N/A | -7.24% | |
| Standard Deviation of Fund | +13.26% | +11.99% | +11.99% | +10.62% | +19.40% | N/A | N/A | +32.07% | |
| Standard Deviation of Benchmark | +16.68% | +15.69% | +15.69% | +13.58% | +20.13% | N/A | N/A | +32.08% | |
| Krungsri Next Generation Infrastructure SSF (KFINFRASSF) | -0.19% | +8.31% | +8.31% | +6.28% | +6.62% | N/A | N/A | +1.24% | 53 |
| Benchmark(11) | +0.91% | +10.98% | +10.98% | +11.51% | +12.07% | N/A | N/A | +6.18% | |
| Standard Deviation of Fund | +12.40% | +11.70% | +11.70% | +9.85% | +11.71% | N/A | N/A | +13.63% | |
| Standard Deviation of Benchmark | +12.25% | +11.69% | +11.69% | +9.89% | +11.98% | N/A | N/A | +13.98% | |
| Krungsri ESG Climate Tech SSF (KFCLIMASSF) | +12.49% | +13.04% | +13.04% | +17.56% | +6.98% | N/A | N/A | +0.42% | 88 |
| Standard Deviation of Fund | +21.45% | +20.38% | +20.38% | +17.45% | +16.81% | N/A | N/A | +19.27% | |
| Krungsri Global Growth SSF (KFGGSSF) | +9.85% | -12.59% | -12.59% | -11.39% | +7.15% | N/A | N/A | -5.85% | 878 |
| Benchmark(11) | +11.08% | -10.84% | -10.84% | -7.38% | +12.78% | N/A | N/A | -1.12% | |
| Standard Deviation of Fund | +27.13% | +25.97% | +25.97% | +21.75% | +22.32% | N/A | N/A | +28.65% | |
| Standard Deviation of Benchmark | +24.53% | +25.42% | +25.42% | +21.99% | +23.68% | N/A | N/A | +29.84% | |
| Krungsri China Megatrends SSF (KFCMEGASSF) | -8.73% | -19.88% | -19.88% | -17.41% | -5.36% | N/A | N/A | -8.71% | 46 |
| Benchmark(12) | -4.36% | -8.08% | -8.08% | +0.27% | +5.81% | N/A | N/A | +2.47% | |
| Standard Deviation of Fund | +25.32% | +24.09% | +24.09% | +21.89% | +29.25% | N/A | N/A | +29.62% | |
| Standard Deviation of Benchmark | +16.94% | +17.31% | +17.31% | +16.74% | +22.14% | N/A | N/A | +22.97% | |
| Krungsri Equity Sustainable Global Growth SSF (KFESGSSF) | +12.49% | +1.81% | +1.81% | -0.17% | +1.80% | N/A | N/A | +3.24% | 35 |
| Benchmark(11) | +13.75% | +4.14% | +4.14% | +4.63% | +7.03% | N/A | N/A | +8.49% | |
| Standard Deviation of Fund | +19.33% | +18.61% | +18.61% | +15.59% | +16.10% | N/A | N/A | +16.77% | |
| Standard Deviation of Benchmark | +18.97% | +18.53% | +18.53% | +15.61% | +16.19% | N/A | N/A | +17.17% | |
| Krungsri Vietnam Equity SSF (KFVIETSSF) | +1.19% | -3.42% | -3.42% | +12.78% | +2.72% | N/A | N/A | -1.17% | 173 |
| Benchmark(13) | +11.77% | +5.95% | +5.95% | +39.97% | +16.58% | N/A | N/A | +8.96% | |
| Standard Deviation of Fund | +14.00% | +18.72% | +18.72% | +19.10% | +17.63% | N/A | N/A | +17.65% | |
| Standard Deviation of Benchmark | +14.61% | +21.61% | +21.61% | +23.23% | +20.89% | N/A | N/A | +22.63% | |
| Fund | Historical Returns | Fund Size (mil) | |||||||
| % Cumulative Return | % Annualized Return | Since Inception | |||||||
| 3 Months | 6 Months | YTD | 1 Year | 3 Years | 5 Years | 10 Years | |||
| Krungsri SET100-SSFX (KFS100SSFX) | +9.21% | +29.09% | +29.09% | +53.55% | +6.91% | +3.94% | N/A | +6.45% | 1,679 |
| SET100 TRI | +9.38% | +29.04% | +29.04% | +54.85% | +7.25% | +4.09% | N/A | +7.15% | |
| Standard Deviation of Fund | +12.44% | +19.25% | +19.25% | +17.50% | +16.07% | +14.43% | N/A | +15.57% | |
| Standard Deviation of Benchmark | +12.63% | +19.44% | +19.44% | +17.61% | +16.17% | +14.54% | N/A | +15.68% | |
| Tracking Difference (TD) | N/A | N/A | N/A | -1.30% | N/A | N/A | N/A | N/A | |
| Tracking Error (TE) | N/A | N/A | N/A | +0.57% | N/A | N/A | N/A | N/A | |
Remark


